Turn TradingView into a Research Terminal
TDR layers structured signals, performance metrics, and risk zones directly onto your charts. Not just another indicator — a research framework you can see.
A Research Framework. Not a Normal Indicator.
Most indicators give you arrows. TDR gives you three layers of structured research data on every chart.
Signal Layer
- Entries, exits, trend state
- Confirmed on candle close
- No repainting, no noise
Data Layer
- Win rate, avg trade, drawdown
- Trade count and distribution
- Performance visible on-chart
Structure Layer
- Risk zones and stop levels
- Take-profit and entry areas
- Trade planning on the chart
See Strategy Performance Without Leaving Your Chart
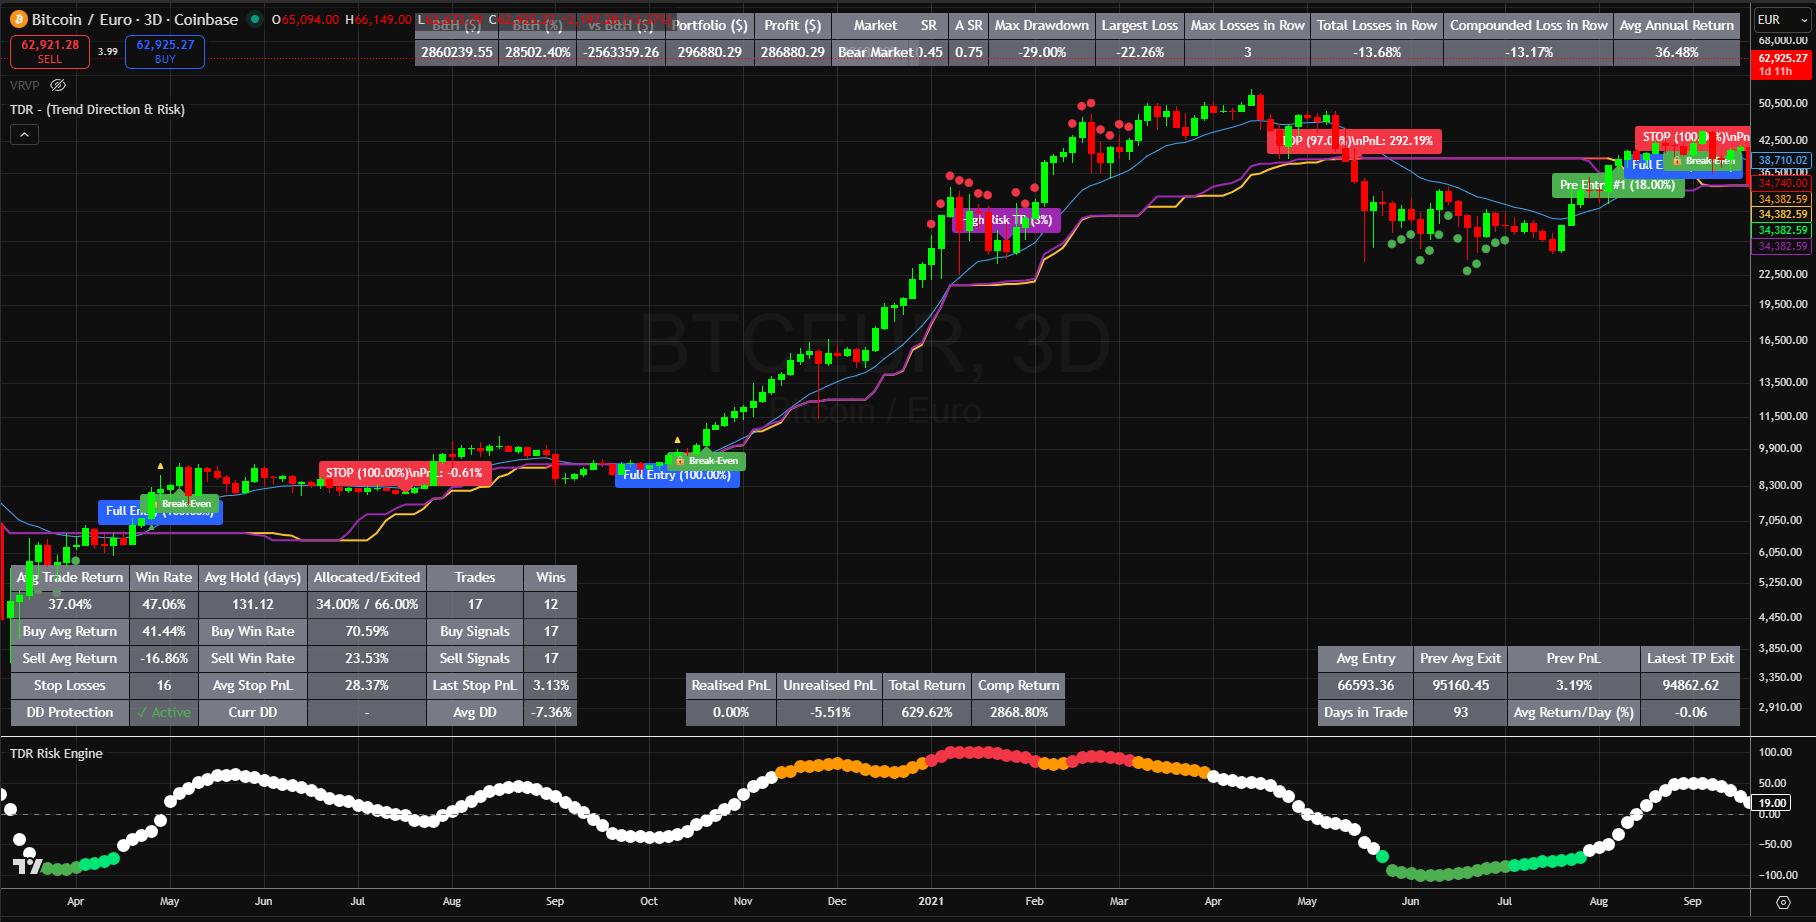
Performance Data. Directly on Chart.
TDR displays live strategy metrics on the chart itself. No need to switch tabs, export spreadsheets, or run a separate backtest.
Example data for illustration. All metrics calculated from confirmed candle data. No lookahead. No repainting.
Built for Research, Not Hype
Every part of TDR exists because it solves a specific problem in systematic trading research.
Adaptive Trend Engine
Filters noise and highlights high-conviction market states using momentum-based logic. Not a moving average overlay.
Execution Signals (No Repainting)
Generated only on confirmed candle closes. What you see is what existed in real time. No after-the-fact adjustments.
Structured Risk Zones
Plots risk zones, take-profit levels, and low-risk entries directly on your chart. Every trade has defined parameters.
Strategy Logic from Quanthop
Built using the same computation engine that powers Quanthop's backtesting and walk-forward validation workflows.
Built for Traders Who Want Structure
Traders who want structure on their charts, not just arrows
People building or validating a strategy before committing capital
Anyone transitioning from discretionary to systematic trading
Users exploring Quanthop who want a visual preview of the research logic
From Chart Observation to Validated Strategy
TDR on TradingView is the starting point. Quanthop is where you go deeper.
Explore on chart
See how TDR identifies trends, risk zones, and trade structure in real time.
Validate in Quanthop
Run the same logic through backtesting with full performance data.
Optimise and stress test
Parameter optimisation, walk-forward analysis, Monte Carlo simulation.
Deploy with confidence
Move from research to execution with validated, data-backed decisions.
Free Access. No Credit Card.
Submit your details
Enter your email and TradingView username below.
We grant access
Your TradingView account gets added, usually within hours.
Add to your charts
Search "TDR" in invite-only indicators on TradingView and apply to any chart.
Stop Guessing. Start Researching Properly.
TDR turns your TradingView charts into a structured research surface — with signals, risk zones, and performance data that actually mean something. Free access. No credit card.
Get Free Access to TDRFor research and educational purposes. Not intended as a standalone trading system.